
How to use Google Analytics as a small business owner
Google Analytics may just be the most important tool in your website tool belt. Having a website is an important part of running any business; a digital storefront to your products and services. Understanding how your customers interact with your website is just as important.
What is Google Analytics?
Google Analytics is a free Google tool that allows website owners to view certain website performance data. Business owners and marketeers can view anything from how many users are visiting your site and how long they’re spending on your website to how many of those people made an enquiry or purchased your goods or services.
Understanding how many people are coming through to your site is important, but it’s how they found you and how they behaved once on the site that really start to tell a story. It’s easy to do and anyone can do it.
How do I set up Google Analytics?
Setting Google Analytics up is pretty straightforward and involves adding a tracking code into the code of your site, by following these four easy steps. Any good web provider should do this for you. If you’re an Oxygen Graphics client then you can skip these steps, because Google Analytics will already be set up for you.
- Go to http://www.google.com/analytics/ and click ‘Sign In To Analytics’. You’ll need a Gmail account, though, so if you don’t select ‘Start For Free’ to set one up.
- Next, follow the instructions to set up a property. A property represents your website and is the collection point in Analytics for the data from your site.
- Once that’s done, you can set up a reporting view within your property. Views allow you to create filtered perspectives of your data; for example, all data except from your company’s internal IP addresses. After all, you want to see the traffic from your customers and not your own team.
- Finally, add the code that Google provides to your site’s code. It’s important to add the code to each and every page across your site, so adding it to the website’s header is a great way to do this.
- You’re all set and ready to start studying your site performance! You’ll start seeing that data from the following day. Google can’t backdate data, as a code must be present on the site in order to start tracking, so it’s important to get that code added as soon as possible!
I have Google Analytics on my site. Now what?
Now that your site has Google Analytics set up, this is where the real fun starts. First of all, you can log in at https://analytics.google.com/ and select your preferred view here.
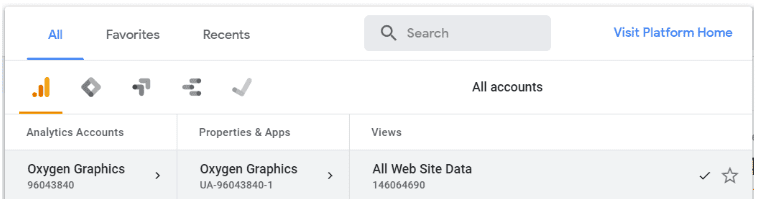
That’s it; you’re in! You’ll want to select a data range from the top right hand corner. A great place to start is the previous full calendar month. You can then compare this to previous months (known as month on month) or the previous year (known as year on year). Here’s our top 5 data sources to look out for.
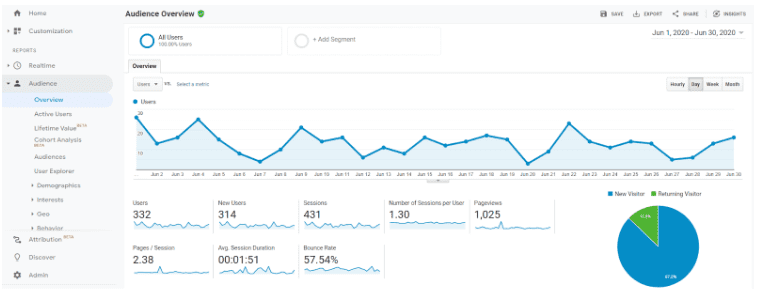
1. Audience → Overview
Your Audience Overview is the window into your site’s performance and provides a summary of your site’s main KPIs, including how many users are viewing the site, new users (which are those that visited your site for the very first time), sessions (which are your total visits, as some users may return to your site several times) and average session duration. This really shows whether or not people are interacting with your site.
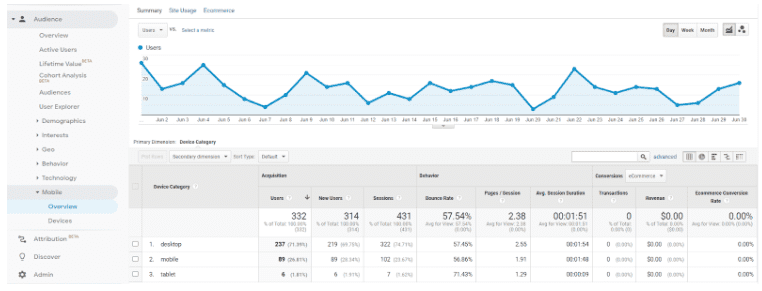
2. Audience → Mobile → Overview
The average website receives 50% of its traffic through mobile devices, 47% of traffic through desktops and just 3% through tablets. This, of course, varies between industry. For example, if you’re a B2B company then you’re customers may be more likely to browse from an office on a desktop. Understanding which devices are being used to enter your site is important, because your website will need to reflect those behaviours. The average session duration and bounce rates will signal if users are struggling on a particular device type. If your site looks fantastic on desktop but not on mobile, it may be time to consider upgrading to a more mobile-friendly and fully responsive website.
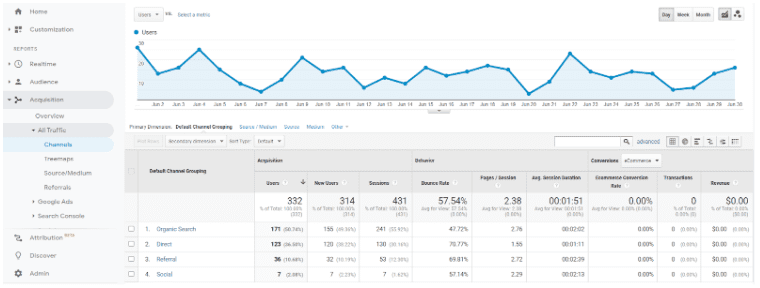
3. Acquisition → All Traffic → Channels
This shows exactly how your customers found you. This section is particularly useful for understanding which of your marketing channels are working best for you. For example, if your organic traffic is particularly high then this suggests that your SEO is working well for you.
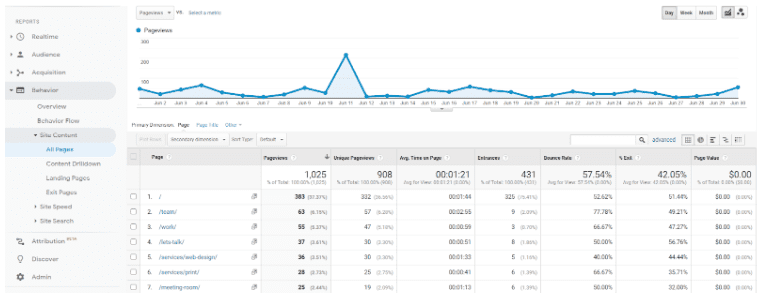
4. Behaviour → Site Content → All Pages
To understand how each separate page is performing, you’ll want to view ‘All Pages’ within the ‘Behaviour’ section. This provides a detailed breakdown of which pages are receiving the most traffic and how long users are staying on there, on average.
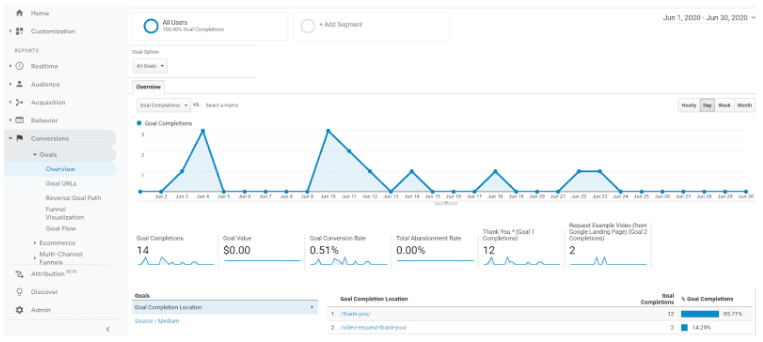
5. Conversions → Goals → Overview
Your goals reveal how many customers converted in some way. There are several types of actions that could be considered a goal, from visiting a contact page to submitting an enquiry form on the website. Your goal conversion rate reveals the percentage of users that completed that goal. Ensuring your site has a strong, fluid user journey and delivering a strong digital marketing strategy can both help increase your conversion rate.
Hopefully by now, you’ve plenty of information to get you started on your Google Analytics journey. Another way to better learn is to simply explore the different sections. There’s nothing that can be broken, as long as you avoid the admin section in the bottom left corner, so play away!
If you have any questions about your site’s performance or would like to understand how to improve on any of your KPIs, then please feel free to get in touch with the Oxygen Graphics team.
In need of marketing support?
Get in contact with a member of our team today to see how Oxygen Graphics can help you!
T : 01788 561 991 E : info@oxygengraphics.co.uk